PDG TOOL
Parametric Data Graphing Tool designed and built in NI LabVIEW
Project Overview
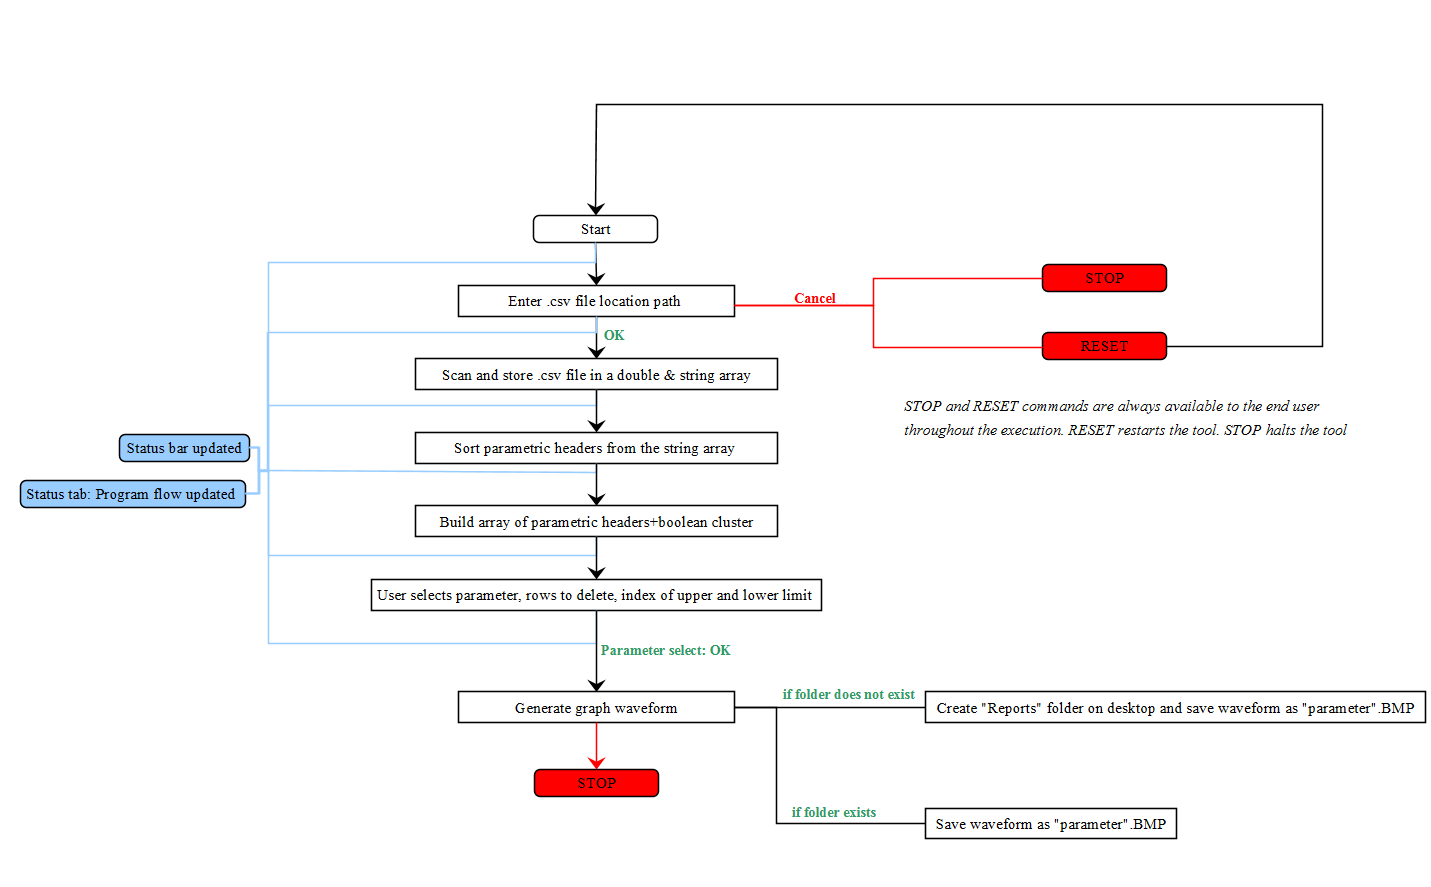
The testers created at Celestica append a Parametric log sheet sheet at the end of each run which contains the names of various tests and the values obtained per UUT. Customers sometime demand for a graphical representation of each test parameter which is tedious to deliver. Therefore, I was assigned with the task of creating a stand-alone processing tool which would take in the paramteric .CSV file and graph the user specified parameter.
Key Learnings
- Creating a LabVIEW windows application
- Software documentation and comments format as per the industry standard